Back
Oil & Gas Industry (Energy)

How to Transform a Complex Oil & Gas Ops Into One Unified Digital Platform?

Streamlining Asset Management Lifecycle to Increase Task Completion for Field Users

Role Lead UX Designer & Product Strategist
Duration 1 Year
Tools
Figma Miro Azure DevOps
Scroll to explore

The Client

Modernizing Internal Ecosystems for a Global Tech Leader

Evergreen Resources is a global technology pioneer providing digital solutions to the oil & gas, renewables, and heavy infrastructure industries. Despite their external innovation, internal operations were hindered by siloed, legacy systems across 80 countries. I led the digital transformation to consolidate complex field operations including drilling, asset management, and maintenance into a unified, real-time interface for their 64,000+ global employees.

Offshore rig operations technician on platform
Problem Definition

Understanding the Challenge

Defining the problem space and opportunity for innovation

Context

Current Landscape

Digital solutions in the energy and heavy infrastructure sectors are often highly specialized but fragmented. While Evergreen Resources delivers advanced technology to external clients, internal operations across 80 countries relied on disconnected legacy frameworks that struggled to keep pace with global demand.

The Problem

Operational Fragmentation

The organization managed four independent, siloed systems for specific well-construction and field verticals. This forced personnel to switch between multiple applications, resulting in significant data inconsistencies, delayed decision-making, and high cognitive load for field teams.

Our Goal

Unified Operational Flow

The objective was to consolidate disparate field-service modules including drilling, asset management, and maintenance into a single, integrated platform. This central ecosystem was designed to provide real-time intelligence and a seamless user experience for a global workforce.

Purpose

Targeted User Impact

This transformation serves a diverse workforce of 64,000 employees across 140 nationalities. By simplifying complex workflows, the platform enables field engineers and project managers to execute high-stakes tasks with increased accuracy and reduced technical friction.

My Responsibility

1

Executed end-to-end user research and strategic planning to align platform capabilities with complex industrial workflows.

2

Developed comprehensive storyboards and scalable IA to unify fragmented data from multiple legacy systems.

3

Applied domain research to simplify high-risk, data-heavy operations.

4

Designed and refined paper and digital wireframes to validate core navigation and task flows early in the process.

5

Collaborated cross-functionally to deliver scalable, production-ready designs.

6

Built a scalable, robust design system to ensure long-term consistency and efficient future development across the ecosystem.

Design Process

My UX Process

A structured, iterative approach to solving complex enterprise challenges

1
Phase 1

Challenge of Domain Complexity

The primary challenge was mastering a complex industrial domain; after the initial briefing, deep domain knowledge was independently synthesized through proactive engagement with Subject Matter Experts (SMEs)

Key Activities
  • Synthesized technical requirements from 55+ stakeholder interviews.
  • Documented constraints via 12-hour technician shift shadowing.
  • Identified friction points across 4 legacy infrastructure verticals.
  • Mapped safety standards for operations across 80 countries.
1
2
2
Phase 2

Structured Requirements Sessions

Aligning disparate vertical needs into a unified operational product roadmap.

Key Activities
  • Facilitated bi-weekly sessions with POs across 4 distinct verticals.
  • Identified shared functional requirements and unique regional needs.
  • Iterated requirements gathering with POs & BAs
  • Defined success metrics to reduce Non-Productive Time (NPT).
3
Phase 3

Introducing "UX Sprint-0"

Optimizing development velocity through proactive design discovery and early validation.

Key Activities
  • Pioneered UX-dedicated sessions separate from the dev sprint.
  • Maintained a 2–3 sprint head start to ensure design readiness.
  • Created discovery cycles that prevented impact on dev velocity.
  • Achieved 100% asset readiness, eliminating all design bottlenecks.
3
4
4
Phase 4

Design Inspiration & Wireframing

Bridging complex requirements with intuitive structural design.

Key Activities
  • Built 30+ low-fidelity flows to validate core journeys.
  • A/B tested key interaction patterns for multiple design approaches
  • Iterated based on data-driven insights
5
Phase 5

Test, Iterate & Deliver

Validating designs through multiple rounds of Product Owner testing and continuous refinement for final engineering readiness.

Key Activities
  • Created detailed design system documentation
  • Collaborated with engineers on implementation
  • Monitored post-launch analytics and feedback
  • Planned roadmap for future enhancements
5
Research

Research Findings

Deep insights gathered through multiple research methodologies

The Existing Ecosystem

Our challenge wasn't to build from scratch, but to elevate an already-live, mission-critical platform. Users were functional but frustrated navigating a maze of siloed modules built over years by different teams. Our discovery became a targeted investigation, run in lockstep with client leads, to pinpoint specific design debts and strategic integration points. We audited workflows, identified consolidation opportunities, and aligned on which legacy patterns to modernize transforming a working tool into an intuitive, unified experience for their global operations.

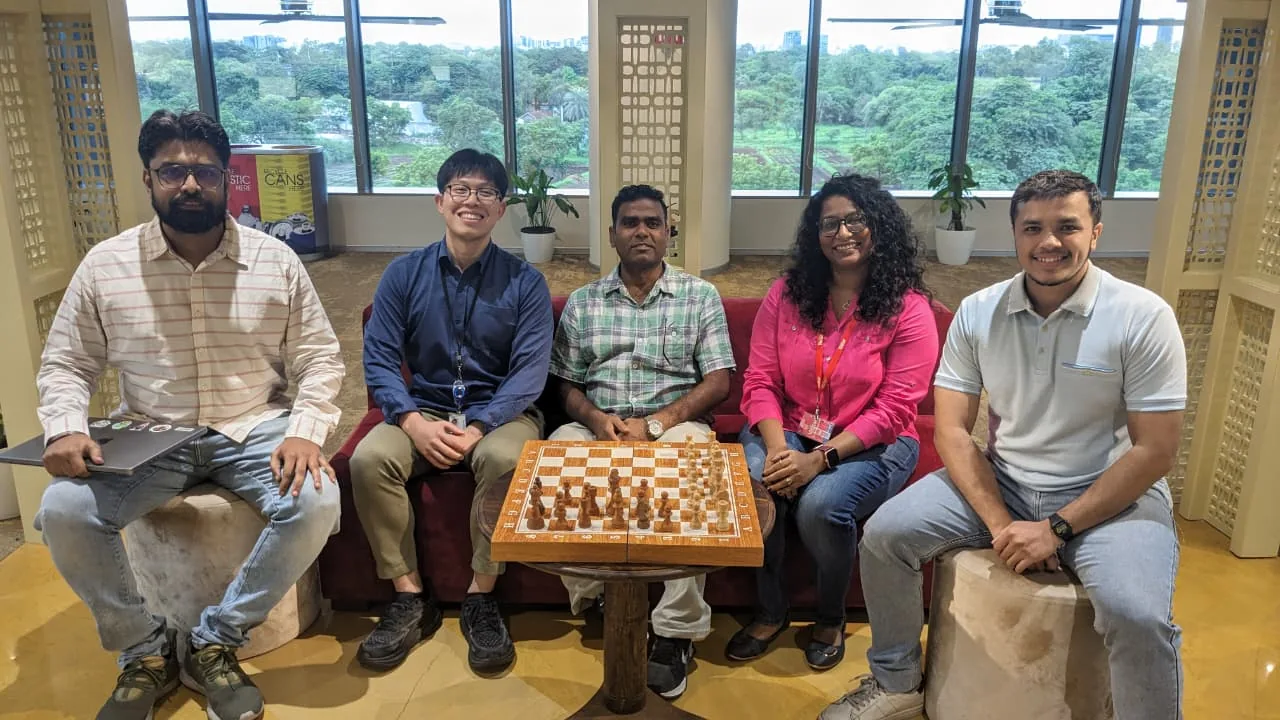
Workshop with POs

Workshop with POs

1

Global User Experience

Simplify complex English-heavy interfaces with visual, intuitive design that works across languages and technical skill levels worldwide.

2

Vertical Unification

Merge four disconnected systems into one platform with consistent navigation and shared data, eliminating confusing context-switching.

3

Process Digitization

Replace unreliable paper logs and manual workflows with streamlined digital tools that work offline and capture data in real time.

Legacy Infrastructure Flaws

Identifying critical operational bottlenecks within the existing fragmented ecosystem.

9 participants (45 min sessions)

KEY FINDINGS

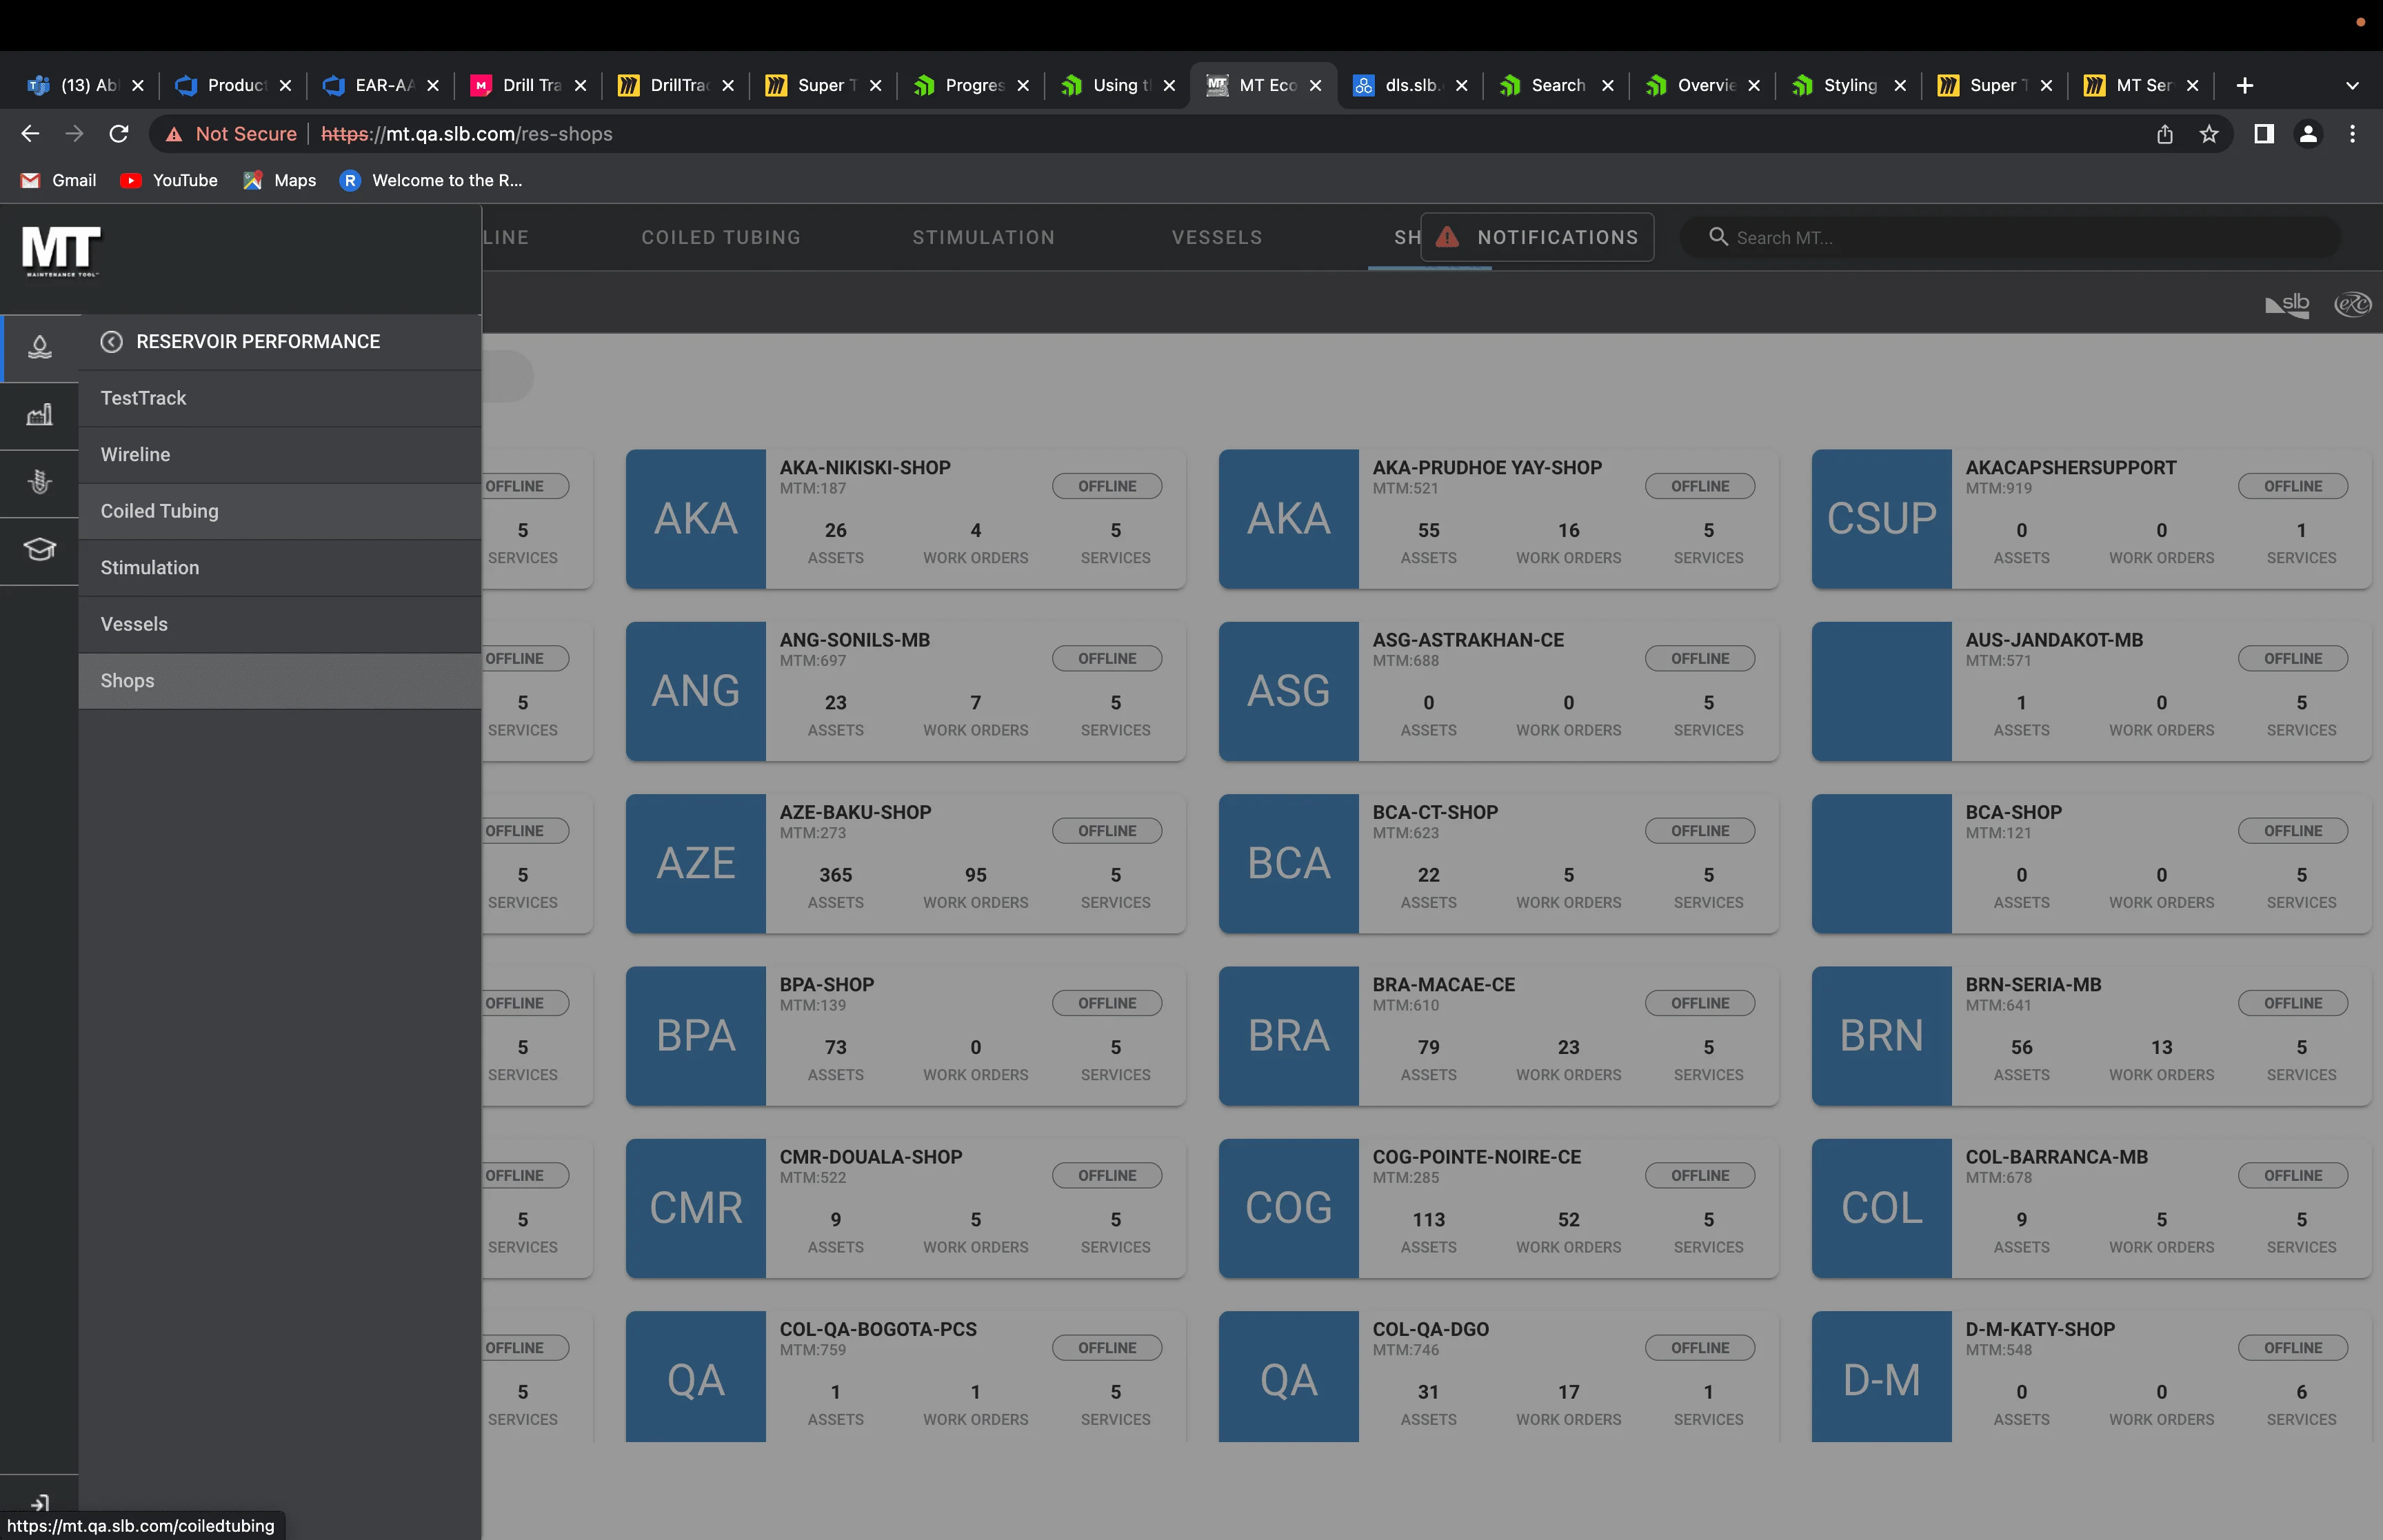
  • 1 Unified 4 disconnected systems requiring constant context-switching.
  • 2 Identified text-heavy, non-intuitive & confusing legacy interfaces.
  • 3 Documented significant reporting delays due to lack of real-time sync.
  • 4 Flagged high error rates from reliance on paper logs.
  • 5 Safety Hazard Information was not highlighted properly.
Legacy Infrastructure Flaws Analysis

Key Insights

1

Users preferred a "day-in-the-life" chronological workflow over traditional functional groupings.

2

Fragmented legacy systems caused significant mental fatigue, requiring a shift toward progressive disclosure.

3

Journey mapping confirmed that 65% of tasks were identical across all four business verticals.

4

A global workforce of 140 nationalities necessitated a move from English-heavy text to intuitive, icon-driven navigation.

User Research

User Personas

Understanding our target users through detailed persona development

Omar Rodriguez

38 • Senior Field Technician (Well Construction)

O
"I need a system that works as fast as I do, especially when I’m wearing gloves and managing high-value assets in the heat."
Goals
  • 1 Log maintenance and inspections for rig assets without manual re-entry.
  • 2 Update equipment availability instantly to prevent Non-Productive Time.
  • 3 Complete mandatory checklists quickly before starting high-risk rig ops.
Pain Points
  • 1 Inability to capture asset data in remote, low-connectivity zones.
  • 2 UI is difficult to navigate with gloves and safety gear.
  • 3 Constant context-switching between siloed vertical modules.
Motivations
  • 1 Minimize reporting to focus on technical drilling.
  • 2 Ensure equipment accuracy to prevent hazardous rig failures.
  • 3 Make faster, data-driven decisions with confidence

Sarah Chen

42 • Third Party Field Supervisor

S
"I need a high-level view of assets and unified platform to view at one login for our global operational KPIs."
Goals
  • 1 Monitor drilling progress and NPT via real-time dashboards.
  • 2 Access drilling, maintenance, inspection and asset logs in one platform.
  • 3 Assign crews based on real-time availability and certifications.
Pain Points
  • 1 Consolidating reports from disconnected vertical systems.
  • 2 Delayed field updates hindering critical safety decisions.
  • 3 Reliance on unreliable paper logs for audit trails.
Motivations
  • 1 Utilizing a single source of truth for global operations.
  • 2 Identifying flaws before they impact safety or timelines.
  • 3 Feel confident adopting digital tools in high-pressure environments.
Design Solutions

Key Design Solutions

Transforming insights into impactful design decisions

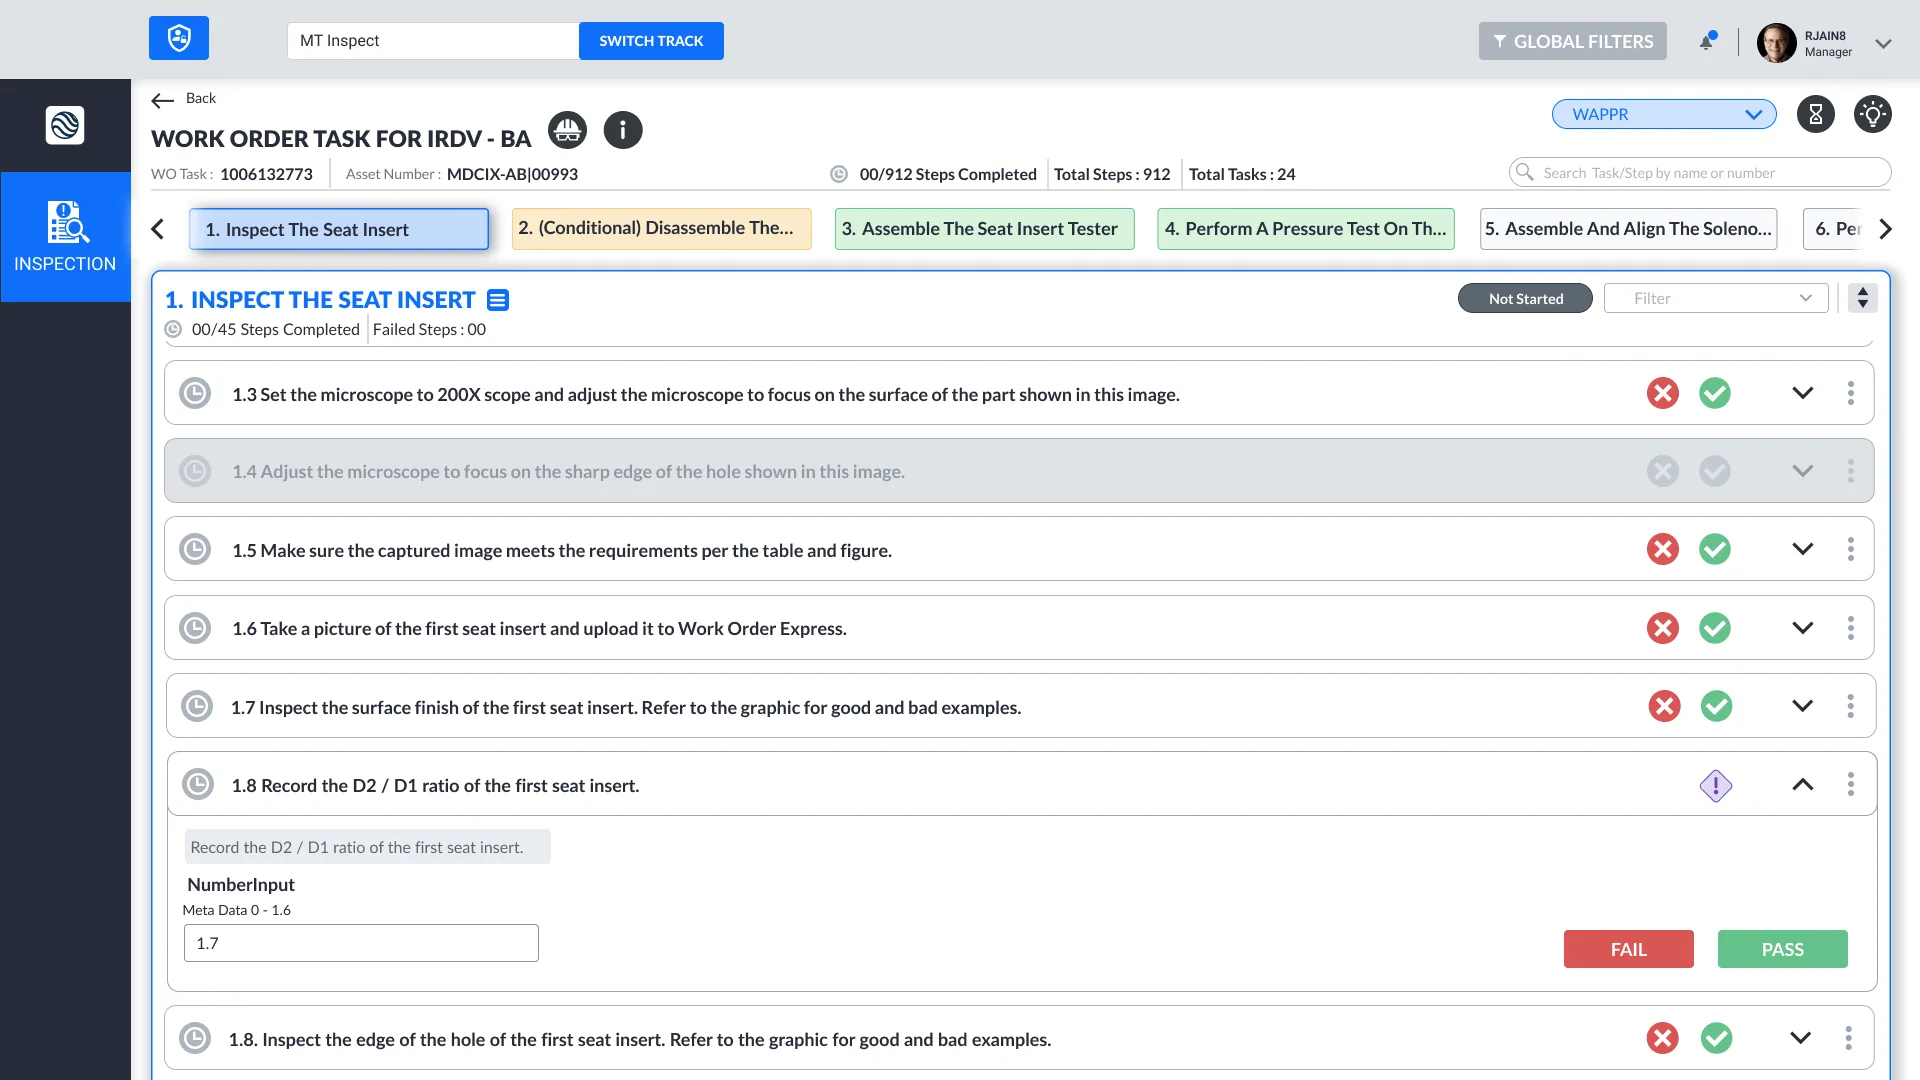
Service Actuals DR Design Screen

My Inspiration

Familiar Inspection View

Mirrored the digital inspection interface to match existing paper documentation structures. Reduced cognitive friction by leveraging "mental model" continuity, allowing technicians to transition to digital without extensive retraining.

Impact High adoption, mandatory safety prompts ensured 100% compliance.

Unified Access & Global Filtering

Implemented Single Sign-On (SSO) and a centralized vertical navigation bar with a persistent global filter. Eliminated the need for multiple credentials across drilling, maintenance, and asset modules.

Impact Reduced context-switching by 60%; eliminated multiple login friction.

Real-World Workflow Simulation

Engineered task flows that chronologically simulate the physical hand-offs between technicians, supervisors, and third-party inspectors. Prioritized a "day-in-the-life" journey over functional software grouping.

Impact Removed bottlenecks by syncing users' tasks in real time.

Consolidated Operations Ecosystem

Integrated asset management, inspections, and drilling operations into a single, no-logout platform. Centralized fragmented data modules to provide a holistic view of the rig's health and operational status.

Impact Removed bottlenecks by syncing users' tasks in real time.
Results & Impact

Measuring Success

Quantifiable improvements demonstrating the value of user-centered design

User Satisfaction 7.5/10 +32%
Time Saved per User 48 hrs/wk +240%
Monthly Active Users 3K+ +156%
Task Completion Rate 89% +67%

To bridge the gap between engineering and human-centric design, I immersed myself in field observations to witness how technicians operated under pressure in full PPE. These insights led to a pivotal shift; optimizing for large field screens and mobile devices to ensure inspections remained effective even while wearing heavy safety gear. By mirroring legacy paper structures in a unified digital ecosystem, average user confidence scores jumped from 5.0 to 7.5/10. This transformation did more than just digitize a process; it empowered supervisors with real-time data for safer, more accurate decision-making and reduced daily reporting time by 40%.

Reflection

Key Learnings

Insights and takeaways from the design process

Process

Sprint 0 Integration

Introduced dedicated UX sessions separate from scrum ceremonies to align early with Product Owners & stakeholders.

Insight

Iterative Validation

Conducted recurring syncs with stakeholders and users to gain real-world clarity on operational challenges.

Outcome

Contextual Clarity

Established that a clear understanding of the existing ecosystem directly leads to more effective, unified solutions.

Process

Cross-Functional Collaboration

Weekly design-engineering syncs from day one prevented technical debt and ensured designs were both aspirational and technically feasible.

Insight

Trust Through Transparency

Explaining design decisions openly, even when complex, built team confidence. The team preferred understanding over mystery.

Outcome

Accessibility Drives Innovation

Implemented a visual-first design system to bridge language barriers for a global workforce of 140 nationalities.

Next Steps

1

Identified a backlog of "good-to-have" features, such as predictive asset health alerts and automated resource scheduling, to further refine the user experience.

2

Prioritized deeper localization for non-English speaking crews, including right-to-left (RTL) support and localized industry terminology to ensure safety across all regions.

3

Developing dedicated mobile applications for field personnel to manage asset inspections and personal work orders in real-time, directly reducing Non-Productive Time (NPT).

4

Enhancing robust offline capabilities to allow technicians to capture critical asset data in remote, zero-connectivity zones without disrupting workflows.

5

Scaling the safety-first design system with a comprehensive library of cross-platform components for faster future development.